This week's objective was the final project.
This project directly relates to the course objectives and lessons because I will be implementing an array of techniques used throughout the course; I will ultimately:
- Determine the problem statement
- Find and clean the data
- Create my hypothesis
- Analyze the data in R
- Visualize the data
- Draw a conclusion
DETERMINE THE PROBLEM STATEMENT:
The purpose of this inferential statistics project is to perform a hypothesis test and determine how people's opinions on the Internet relate to three different factors. Specifically, whether differences in their age, income, and cell phone usage correlate with their opinion that the Internet has a positive impact on society.For this data set which is largely categorical, it is most fitting to use a chi-square test for independence. Conducting one of these tests for each of the three categories will give insight as to whether the two given categorical variables are related or not. The response variable (opinion on Internet) is not continuous, so an ANOVA test would not be suitable for analysis given the problem statement.
This relates to an exercise in the coursework where a contingency table was provided to perform analysis on hotel attendance. I likewise will clean my data into a contingency table in Excel to perform the test.
FIND AND CLEAN THE DATA:
It would be preferable to use a larger sample size that includes data from 2017 or previous to reveal any trends over time, however, this specific Pew Research Center survey was only started in 2018 and has not been repeated since with similar questions. I believe useful insight can still be drawn from the this single data set given the sample size and reliable source.2018 Data Source: https://www.pewresearch.org/internet/dataset/jan-3-10-2018-core-trends-survey/
The set originally contained over 70 variables for each of the over 2,000 records. Each of these variables were code IDs corresponding to a particular question from the survey.
I made the decision to focus on these select codes specific to this analysis:
PIAL11: Has the internet had a good or bad impact
          on society?
	1 = Good thing
	2 = Bad thing

PIAL12: Would you say the internet has mostly been a
        good or bad thing?
	1 = Good thing
	2 = Bad thing

AGE:
	____	years [RECORD EXACT AGE 18-97]
	18-25
	26-45
	46-65
	66-97

INC:
	Last year -- that is in 2017 -- what was your total
  family income from all sources, before taxes?
	1 = Less than $10,000
	2 = 10 to under $20,000
	3 = 20 to under $30,000
	4 = 30 to under $40,000
	5 = 40 to under $50,000
	6 = 50 to under $75,000
	7 = 75 to under $100,000
	8 = 100 to under $150,000, OR
	9 = $150,000 or more

C1:
	Is there at least one telephone INSIDE 	your home
  that is currently working and is not a cell phone?
	1	Yes home telephone
	2	No, home telephone
This sample will allow me to narrow the focus of this study and comply with the requirements of being between 5 and 20 variables and at least 200 observations.
After some cleaning, I created the following contingency tables for the analysis (with each cell >5 samples per 𝛘2 test requirements):
| Good impact | Bad impact | Total | |
|---|---|---|---|
| 18 - 25 | 132 | 23 | 155 |
| 26 - 45 | 329 | 38 | 367 |
| 46 - 65 | 393 | 64 | 457 |
| 66 - 97 | 196 | 32 | 228 |
| 1050 | 157 | 2414 |
| Good impact | Bad impact | Total | |
|---|---|---|---|
| 1 = Less than $10,000 | 75 | 18 | 93 |
| 2 = 10 to under $20,000 | 83 | 23 | 106 |
| 3 = 20 to under $30,000 | 112 | 14 | 126 |
| 4 = 30 to under $40,000 | 84 | 15 | 99 |
| 5 = 40 to under $50,000 | 79 | 10 | 89 |
| 6 = 50 to under $75,000 | 154 | 22 | 176 |
| 7 = 75 to under $100,000 | 139 | 19 | 158 |
| 8 = 100 to under $150,000 | 156 | 21 | 177 |
| 9 = $150,000 or more | 168 | 15 | 183 |
| 1050 | 157 | 2414 |
| Good impact | Bad impact | Total | |
|---|---|---|---|
| Home phone | 296 | 51 | 347 |
| No home phone | 754 | 106 | 860 |
| 1050 | 157 | 2414 |
CREATE MY HYPOTHESIS:
Null hypothesisH0: The survey opinion that the Internet positively impacts society is independent of the survey categories of age, income, and cell-phone usage. (Note: Assuming a significance level of α = 0.05)
Alternative hypothesis
H1: The survey opinion that the Internet positively impacts society is not independent of the survey categories of age, income, and cell-phone usage. (Note: Assuming a significance level of α = 0.05)
ANALYZE THE DATA IN R:
#Import contingency tables
> c_age <- read.csv("age.csv", header=T)
> c_income <- read.csv("income.csv", header=T)
> c_phone <- read.csv("phone.csv", header=T)

#Chi-squared test for age and Internet opinion
> chisq.test(c_age[1:4,2:3])

	Pearson's Chi-squared test

data:  c_age[1:4, 2:3]
X-squared = 3.3567, df = 3, p-value = 0.3398

#Chi-squared test for income and Internet opinion
> chisq.test(c_income[1:9,2:3])

	Pearson's Chi-squared test

data:  c_income[1:9, 2:3]
X-squared = 15.558, df = 8, p-value = 0.04916

#Chi-squared test for cell-phone use and Internet opinion
> chisq.test(c_phone[1:2,2:3])

	Pearson's Chi-squared test

data:  c_phone[1:2, 2:3]
X-squared = 1.0285, df = 1, p-value = 0.3105
Here we see the resulting p-values (within their respective degrees of freedom) as:
- Age: 0.3398
- Income: 0.04916
- Phone: 0.3105
VISUALIZE THE DATA:
#Import raw survey data for visualization
#This is what the contingency tables were based on
> age_flat <- read.csv("age_flat.csv", header=T)
> income_flat <- read.csv("income_flat.csv", header=T)
> phone_flat <- read.csv("phone_flat.csv", header=T)
> opinion_flat <- read.csv("opinion_flat.csv", header=T)
#Sort and plot source data for reference
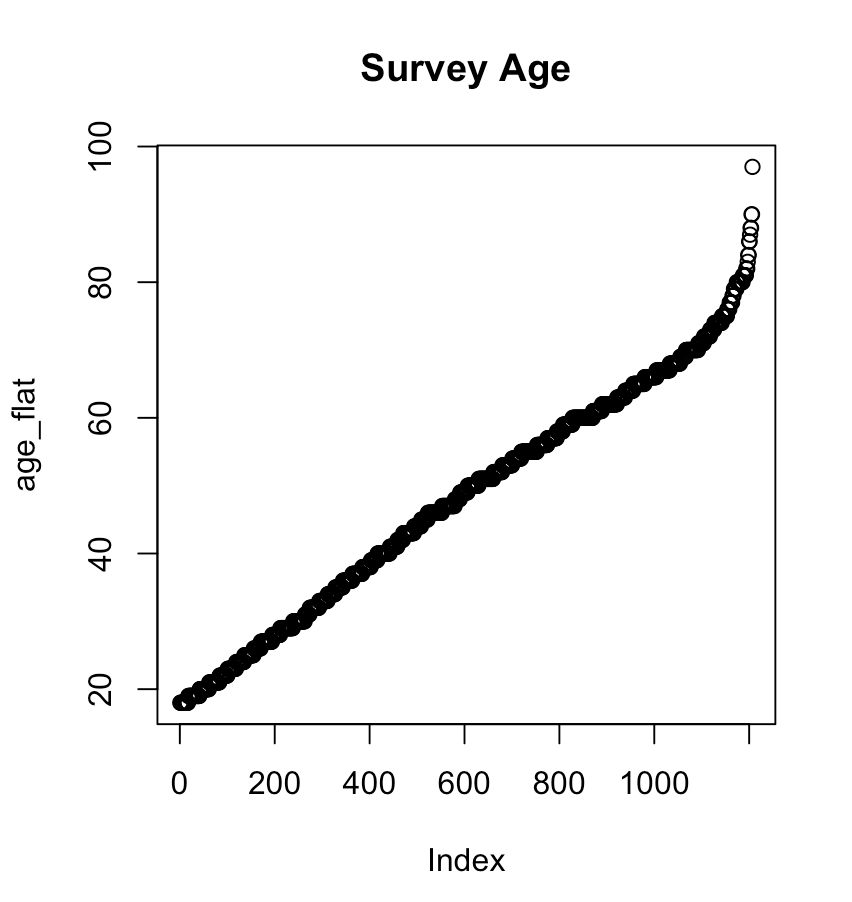
> age_flat <- sort(age_flat[,2],)
> plot(age_flat, main="Survey Age")
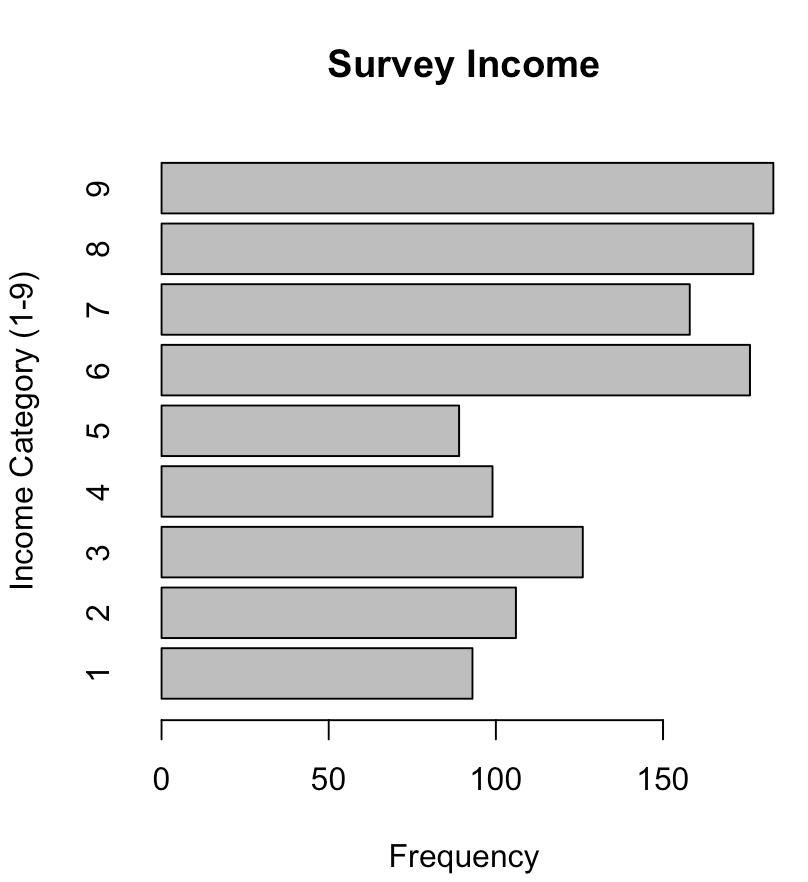
> barplot(table(income_flat), main="Survey Income",
          xlab="Frequency", ylab="Income Category
          (1-9)", horiz=T)
> barplot(table(phone_flat), main="Survey Cell-phone
          Usage", xlab="Frequency", ylab="1 = No,
          2 = Yes", horiz=T)
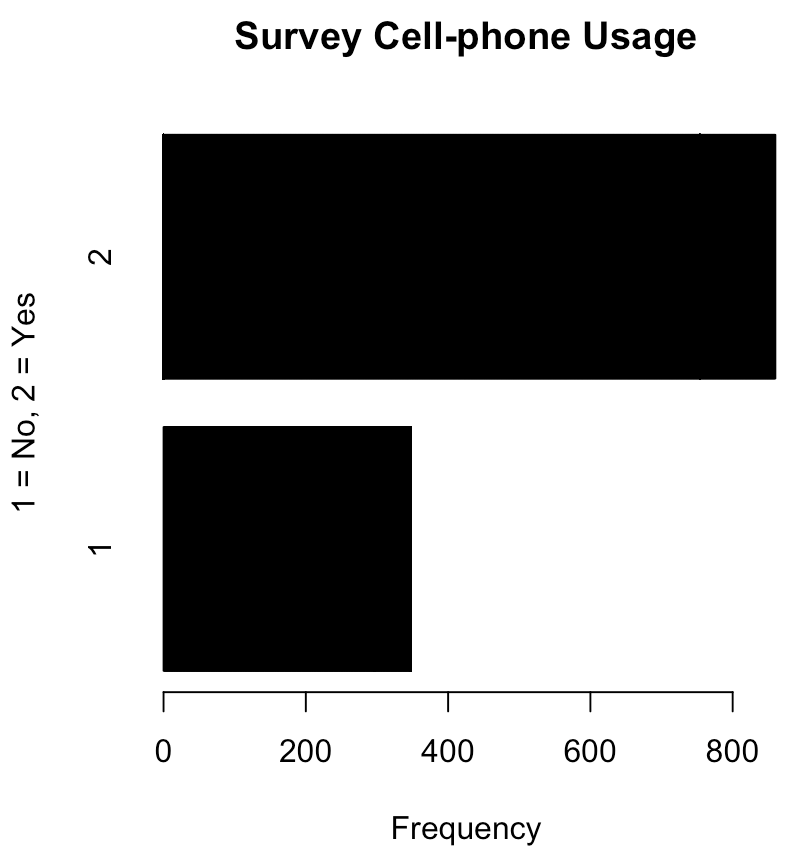
Thusfar, the visualizations do not lead to any useful inferences. Age appears to be nearly equally distributed, income is slightly weighted towards the upper end of the spectrum, and there is a large distinction between those who do and do not have a cell-phone (the overwhelming majority being that the subject does own and use a cell-phone). These visualizations depict only the mean of the individual sample characteristics, so a comparison of the variable against the responsive variable is needed. This follows:
#Install ggplot2 for visualization
> install.packages("ggplot2")
> library("ggplot2")
#Import survey results as data frames for convenience
#with ggplot
> df_age <-read.csv("age_plot.csv", header=T)
> df_income <- read.csv("income_plot.csv", header=T)
> df_phone <- read.csv("phone_plot.csv", header=T)
#Visualize each survey factor against the survey opinion
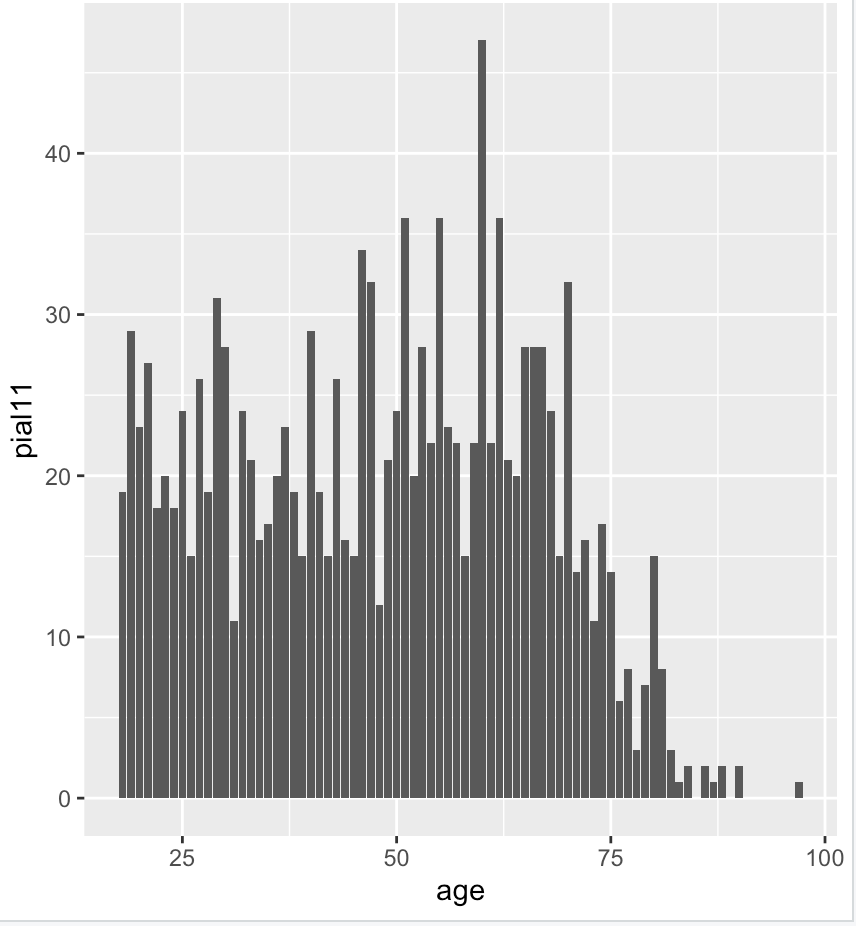
> ggplot(data=df_age, aes(age, pial11)) +
geom_bar(stat="identity")
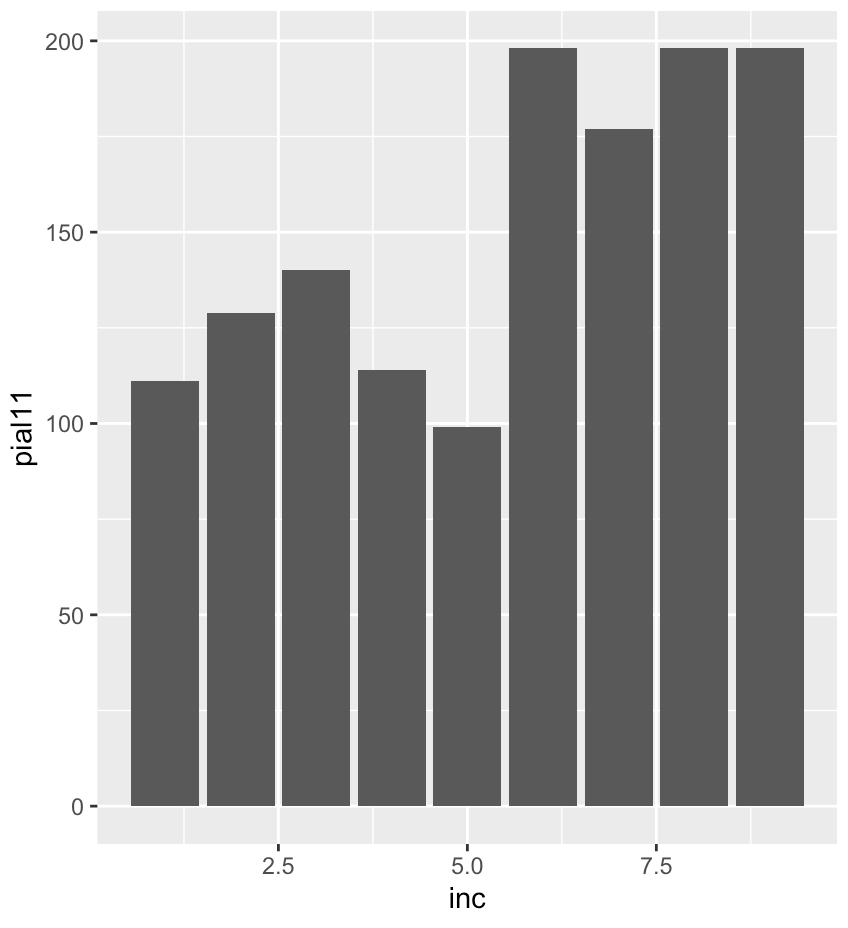
> ggplot(data=df_income, aes(inc, pial11)) +
    geom_bar(stat="identity")
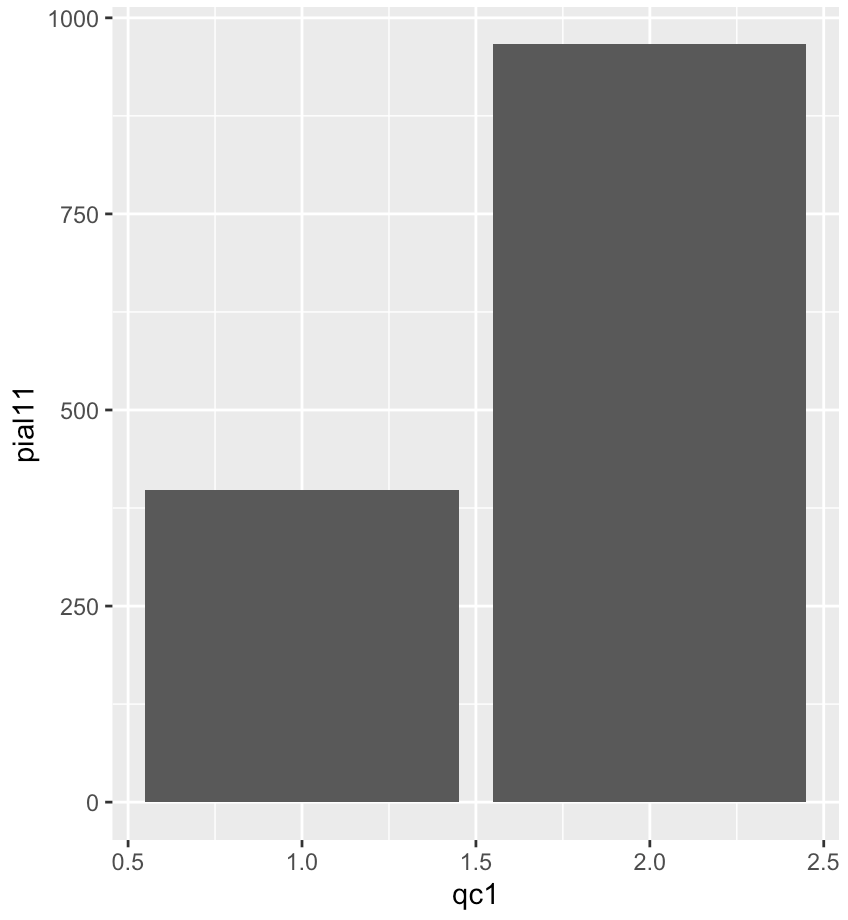
> ggplot(data=df_phone, aes(qc1, pial11)) +
    geom_bar(stat="identity")
#Import multiple variables as data frame
> df_all <- read.csv("total_plot.csv", header=T)
> ggplot(df_all, aes(x=opinion, y=age, fill=income))
    + geom_col(position="fill")
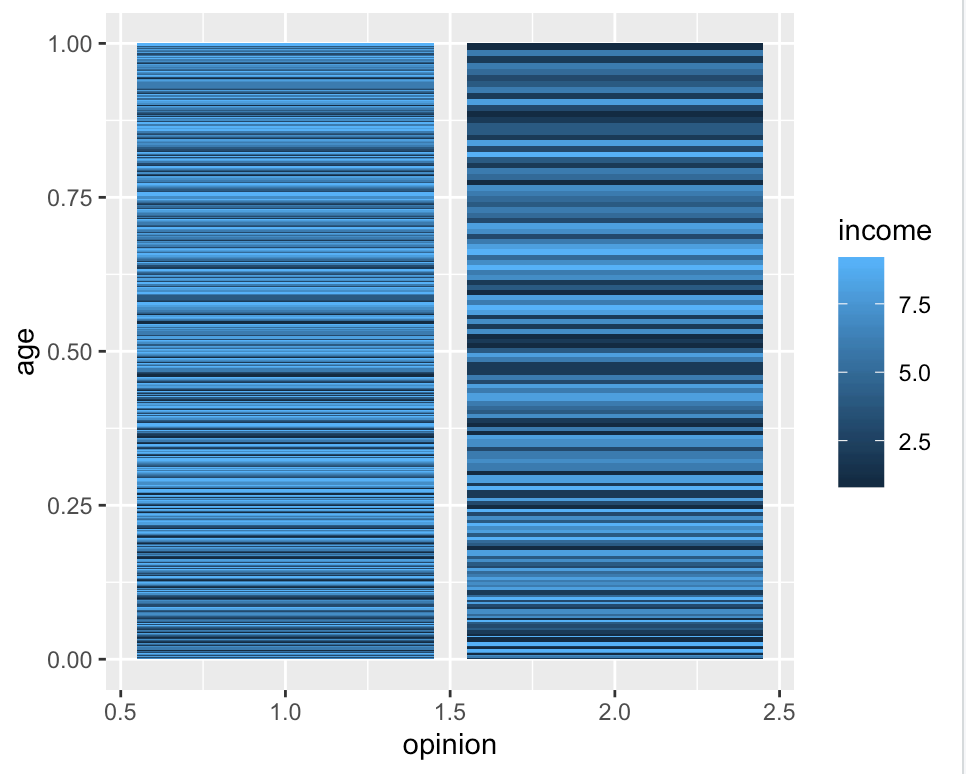
This stacked bar graph attempts to display a relationship between income, age, and opinion on the Internet. A line graph could alternatively have been used, however, the differences in categorization (binary, 1-9, 1-4, etc.) make it difficult to interpret any meaning. The relationship observed here, is most strongly show by the distinction of the opionion and income variables; the lower income group (darker shade) correlates more strongly with opinion response 2 (that Internet does not positively impact society). This is supported by the p-values earlier shown from the 𝛘2 tests.
DRAW A CONCLUSION:
From the results of the 𝛘2 critical values and visualizations, the p-value is less than 0.05 confidence level for only the variable of income, so we reject H0 only for that variable and conclude (Note: Assuming a significance level of α = 0.05):- The survey opinion that the Internet positively impacts society is independent of the survey category of age. (H0 not rejected)
- The survey opinion that the Internet positively impacts society is not independent of the survey category of income. (H0 is rejected)
- The survey opinion that the Internet positively impacts society is independent of the survey category of cell-phone usage. (H0 not rejected)