This week's topics covered tests for population proportion and population mean, statistical significance, and
using a confidence interval to draw a conclusion about a two-tailed test.
Question # 1 : The director of manufacturing at a cookie factory needs to determine whether a new machine is producing a particular type of cookie according to the manufacturer's specifications, which indicate that cookies should have a mean of 70 and standard deviation of 3.5 pounds. A sample pf 49 of cookies reveals a sample mean breaking strength of 69.1 pounds.
State the null and alternative hypothesis _____.
H0: The machine is producing according to the manufacterer's
  specifications (μ ≥ 70).
Ha: The machines is not producing according to the
  manufacturer's specifications (μ < 70).
Is there evidence that the machine is not meeting the manufacturer's specifications for average strength? Use a 0.05 level of significance _____.
> mu <- 70 #population mean
> sd <- 3.5 #standard deviation
> n <- 49 # sample size
> xhat <- 69.1 #sample mean
> alpha <- 0.05
> c <- 0.95 #critical value
> test_stat <- ((xhat - mu) / (sd/sqrt(n)))
> z <- qnorm(c + (alpha/2)) * -1
> cat("The test statistic is ", test_stat, " and the z value
  is ", z, ". We cannot reject the null hypothesis because
  the test statistic is greater than the z value statistic.")

The test statistic is  -1.8  and the z value is  -1.959964 .
We cannot reject the null hypothesis because the test
statistic is greater than the z value statistic.
Compute the p value and interpret its meaning _____.
> p <- pnorm(test_stat)
> p
[1] 0.03593032
# The p value is < α (0.05), so we can reject the
  null hypothesis.
What would be your answer in (B) if the standard deviation were specified as 1.75 pounds?
> sd <- 1.75
> test_stat <- ((xhat - mu) / (sd/sqrt(n)))
> cat("The test statistic is ", test_stat, " and the z value
  is ", z, ". We can reject the null hypothesis because the
  test statistic is lesser than the z value statistic.")

The test statistic is  -3.6  and the z value is  -1.959964.
We can reject the null hypothesis because the test statistic
is lesser than the z value statistic.
What would be your answer in (B) if the sample mean were 69 pounds and the standard deviation is 3.5 pounds?
> xhat <- 69
> sd <- 3.5
> test_stat <- ((xhat - mu) / (sd/sqrt(n)))
> cat("The test statistic is ", test_stat, " and the z value
  is ", z, ". We can reject the null hypothesis because the
  test statistic is lesser than the z value statistic.")

The test statistic is  -2  and the z value is  -1.959964.
We can reject the null hypothesis because the test statistic
is lesser than the z value statistic.
Question # 2 : If x̅ = 85, σ = standard deviation = 8, and n=64, set up 95% confidence interval estimate of the population mean μ.
> xhat <- 85 #sample mean
> sd <- 8 #population standard deviation
> n <- 64 #sample size
> z <- 1.96
> me <- z*(sd/sqrt(n))
> lower <- xhat - me
> upper <- xhat + me
> cat("We can say with 95% confidence that the population
  mean is between (", lower, ", ", upper, ")")

We can say with 95% confidence that the population mean
is between ( 83.04 ,  86.96 )
Question # 3 : The accompanying data are: x= girls and y =boys. (goals, time spend on assignment)
Calculate the correlation coefficient for this data set _____.
> data <- read.csv(file = "m8.csv")
> print(data)
                         X Girl1 Girl2 Girl3 Boy1  Boy2  Boy3
1                    Goals     4     5     6  4.0   5.0   6.0
2                   Grades    49    50    69 46.1  54.2  67.7
3                 Popular     24    36    38 26.9  31.6  39.5
4 Time spend on assignment    19    22    28 18.9  22.2  27.8
5                    Total    92   108   135 95.9 113.0 141.0
> x <- c(data[["Girl1"]][5],data[["Girl2"]][5],data[["Girl3"]][5])
> y <- c(data[["Boy1"]][5],data[["Boy2"]][5],data[["Boy3"]][5])
> dframe <- data.frame(x,y)
> corr <- cor(x,y)
> cat("The correlation coefficient is: ", corr)
The correlation coefficient is:  0.9999681
Pearson correlation coefficient _____.
> pearson <- cor(dframe, method="pearson")
> cat("The Pearson correlation coefficient is: ", pearson)
The Pearson correlation coefficient is:
  1 0.9999681 0.9999681 1
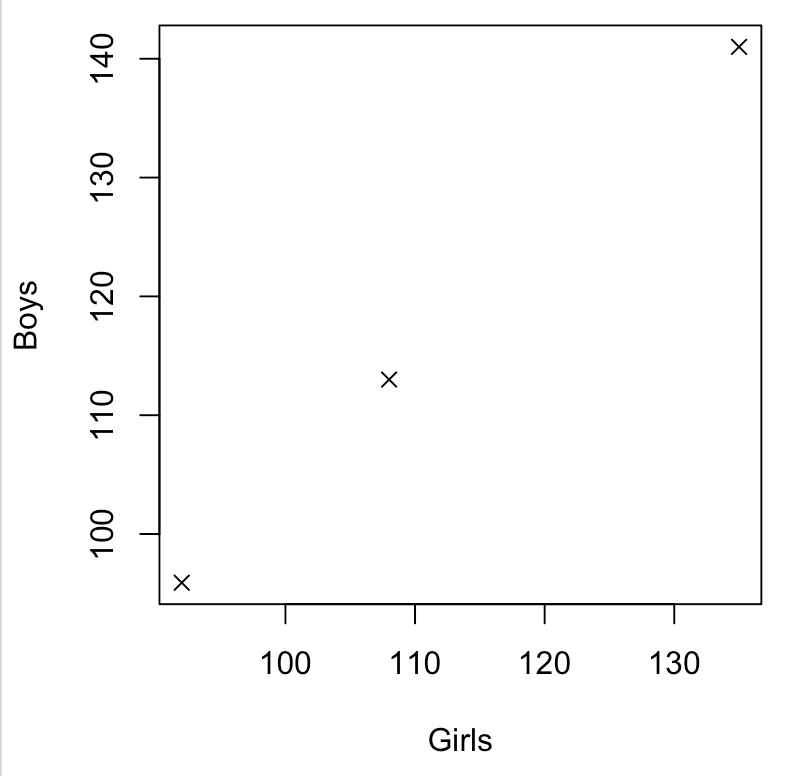
Create plot of the correlation.
> plot(x, y, xlab="Girls", ylab="Boys", pch=21)