This week I was able to successfully install R Project and R Studio. Then I proceeded to test the programs with some sample exercises from the Module #2 reading:
    > librarynumbers <- c(85751, 137103, 126010, 7860, 170)
    > mean (librarynumbers)
    [1] 71378.8
    > median (librarynumbers)
    [1] 85751
    >
The module video presentation covered basic terminologies and the differences between descriptive statistics, inferential statistics and predictive analytics.
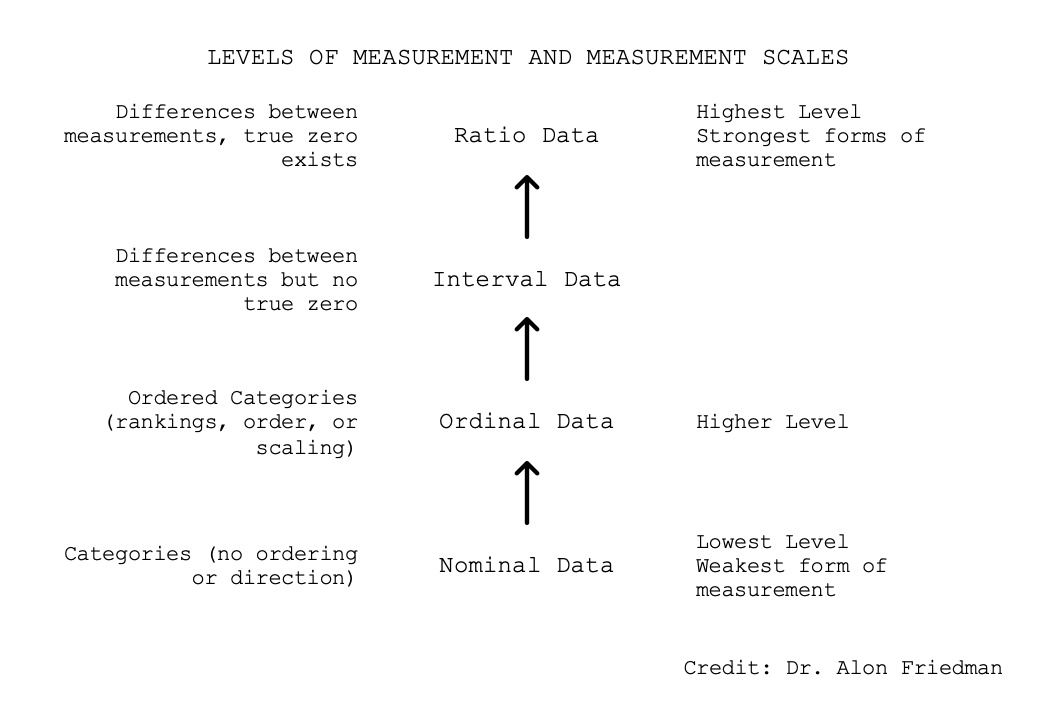
The diagram above is a scale which is applied to data. These elements bring context to the type of data being analyzed, and represent a hierarchy with ratio data being the most useful.